Everything you never realized you wanted to know about Audio Isolation Transformers.
Full details: https://github.com/open-headset-interconnect-standard/collected-data/tree/main/Audio%20Transformers
Summary: I had a customer ask about the frequency response of the OHIS hardware I make.
“I, uhh… don’t know? I know what I designed it to, and it SOUNDS fine to me… But I’ve never measured it!” Ok, let’s do this thing.
The most likely component to affect the frequency response is the audio isolation transformers. I used the Bourns SM-LP-5001, which claims 200Hz to 4kHz. That’s great for communications grade, but not so great for audiophile gear.
Good news! My HHI products don’t claim to be audiophile grade!
But it got me thinking, are there better alternatives? Can I find transformers that are still reasonably priced, but perform better? What is “better?” Is it just frequency response, or also distortion? How does the amount of power being sent through the transformer affect the performance?

And so I did.
I made a small board, with footprints for several different audio isolation transformers, and BNC input and output connectors, for easy connection to an Analog Discovery 2 to take measurements. I bought several different inexpensive audio isolation transformers from Mouser, eBay, and AliExpress. I hooked them all up and took some measurements.
Full results are posted here: https://github.com/open-headset-interconnect-standard/collected-data/tree/main/Audio%20Transformers
tldr:
Even the “bad” transformers weren’t nearly as bad as I expected. As long as the signals aren’t too large, the frequency response graphs extend pretty low and high. Some responses are flatter, others more curvy. Some deal better with more power than others. But none of them were terrible, none would account for audio sounding like it was being sent through a radio or telephone.
For example, this is the Bourns SM-LP-5001, with a 1v peak (0.7v RMS) signal:
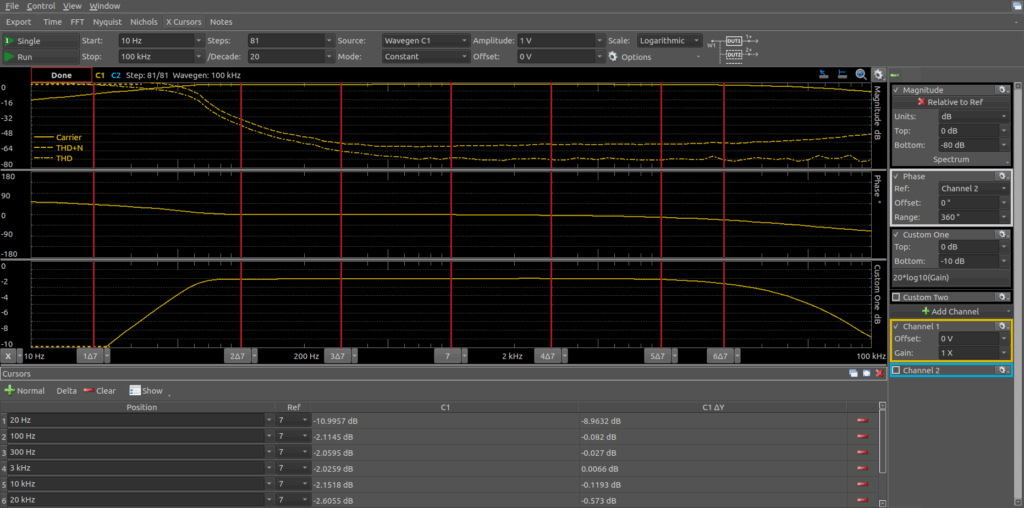
The graph shows 10Hz up to 100kHz. Top graph is 0dB to -80dB, showing Gain, THD, and THD+N. Middle graph is Phase. Bottom graph is Gain again, but zoomed in to 0dB to -10dB. That strong low-end roll-off starts at about 80Hz, which is pretty low! And it’s down by less than 1dB at 20kHz. This is WAY better than I’d expect from a “200 to 4kHz” transformer. And it’s even better at 300mV and 100mV.
If you need to select an Audio Isolation Transformer for a project, check out the data to help you select an option. And if you have any other transformers you’d like to measure, feel free to send me a pull-request with your data!
73 de N6MTS

Yeah, I appreciate the effort and the report.
I first became interested in this when someone replaced the isolation transformers in the SignaLink soundcard devices and later the manufacturer acknowledged this by going with the recommendations in their production.
To this day, if you are deploying a wide audio bandwidth use case, think Winlink VARA FM wide, and you get a SignaLink device, you want the ones with the black transformers, not the old red ones you would see in your ancient AM radio.